·

How Much Life Insurance Do I Need in Canada? 2026 Calculator Guide
By Parvesh Benning, Founder and President of Protect Your Wealth and licensed life insurance broker.
The right amount of life insurance is the amount that gives you peace of mind, and a calculator alone rarely gets you there.
Run the calculator below. It will give you a number based on your income, debts, and dependants. That number is a useful starting point, not the final answer. The right amount of life insurance should be easy to explain: what it pays off, how many years of income it replaces, and which financial obligations it protects. This guide walks through both the math and the conversation that follows.
Updated: May 3, 2026

How Much Life Insurance Do I Need in Canada? 2026 Calculator Guide
By Parvesh Benning, Founder and President of Protect Your Wealth and licensed life insurance broker.
The right amount of life insurance is the amount that gives you peace of mind, and a calculator alone rarely gets you there.
Run the calculator below. It will give you a number based on your income, debts, and dependants. That number is a useful starting point, not the final answer. The right amount of life insurance should be easy to explain: what it pays off, how many years of income it replaces, and which financial obligations it protects. This guide walks through both the math and the conversation that follows.
Updated: May 3, 2026
Most calculators return one number. The number is rarely wrong. It’s rarely the whole answer either. Two people with identical incomes and mortgages can need very different coverage depending on life stage, dependants, existing assets, and what carriers will actually offer them.
The calculator below returns three numbers: a basic figure for a fixed term, a family figure that covers your kids to independence, and a full figure that covers you to retirement. The guide explains the math behind each, where group benefits and registered savings fit, and where disability and critical illness round out the picture.
Inside this guide
12 sections, 2 calculators, full coverage methodology
01
Free Canadian Life Insurance Calculator
Tool
02
The Three Planning Horizons: Basic, Family, Full
Framework
03
Income Replacement: After-Tax, Not 10x Gross
Methodology
04
Mortgage and Debt: The First Numbers to Cover
Methodology
05
Children and Dependants: Long-Term Support Math
Methodology
06
Life Insurance for Renters and the Self-Employed
Special Cases
07
Life Stage Coverage: How Much at 30, 40, 50, and 65
Anchor
08
Why RRSPs and Group Benefits Don’t Fully Offset Need
Tool + Math
09
8 Signs Your Coverage May Be Too Low
Diagnostic
10
When a Higher Amount Is Justified
Special Cases
11
Disability and Critical Illness: The Other Two Legs
Beyond Life
Free Canadian Life Insurance Calculator
The calculator above returns three coverage figures across three planning horizons. We’ll get to what those mean in the next section. The right amount of life insurance is the amount that gives you peace of mind. The way I see it, you should know exactly why a calculator returned the number it did before you buy it, push it higher, or pull it back.
The number changes from person to person for predictable reasons: income, debts, dependants, and existing coverage. But two clients with identical inputs can land on very different recommendations because of one thing the calculator can’t see — life stage. A 32-year-old with a new mortgage and a 9-month-old has a completely different time horizon than a 58-year-old with a paid-down house and adult kids. Same income, same debts, very different number.
What it covers
After-tax income replacement, mortgage and debt, dependant support, final expenses, existing coverage offsets, plus a disability and critical illness estimate.
What it skips
CPP survivor benefits, OAS, and group health coverage. Those are conversation items, not formula items.
The sections below break the math down piece by piece. If your number feels off, the answer is almost always sitting in one of them.
Canadian Life Insurance Coverage Estimator
Estimate how much after-tax income your family would lose, and what coverage range to consider.
Using Tax Year 2026 Information
The Three Planning Horizons: Basic, Family, Full
The calculator returns three numbers because there are three legitimate ways to size life insurance, and each one answers a different question. The cheapest option is not always the right one, and the most expensive is not always overkill. Pick the horizon that matches what you’re actually trying to protect.
Most clients I speak with end up landing somewhere between the Family and Full figures. The Basic figure is a floor, not a target. Here’s how each one works:
Horizon 01
Basic
Coverage for a fixed term, typically 10, 15, or 20 years. Sized to wipe out current debts plus a buffer for income replacement during your highest-obligation years.
Best for
Tight budgets, single applicants with no dependants, or coverage layered on top of an existing larger policy.
Horizon 02
Family
Coverage that lasts until your kids reach financial independence (age 18, 22, or 25 depending on what you’re funding). Sized to replace income through their dependent years.
Best for
Parents with dependent children. The most common recommendation in my practice. Most term policies sit in this range.
Horizon 03
Full
Coverage to retirement age, sized to replace your full earning trajectory plus growth for inflation. Larger upfront face amount, longer term.
Best for
Higher earners, business owners, two-income households where one earner carries the bulk of family income, and anyone wanting maximum protection through peak earning years.
The Basic figure is the price-of-entry option. The Family figure is the most common recommendation in my practice. The Full figure is the one most calculators don’t even show you, but it’s often the right call for primary earners in their thirties and forties when premiums are still cheap and the income at risk is decades long.
If you’re staring at three numbers and not sure which to use, default to the Family figure as a starting point and adjust from there. The next sections walk through the math underneath each piece.
Income Replacement: After-Tax, Not 10x Gross
Income replacement is the foundation of every coverage recommendation, and it’s where most online calculators get the math wrong. The old rule of thumb was 10 times your gross salary. That number is easy to remember and almost always inflated. The reason: your family doesn’t lose your gross income when you die. They lose your take-home pay.
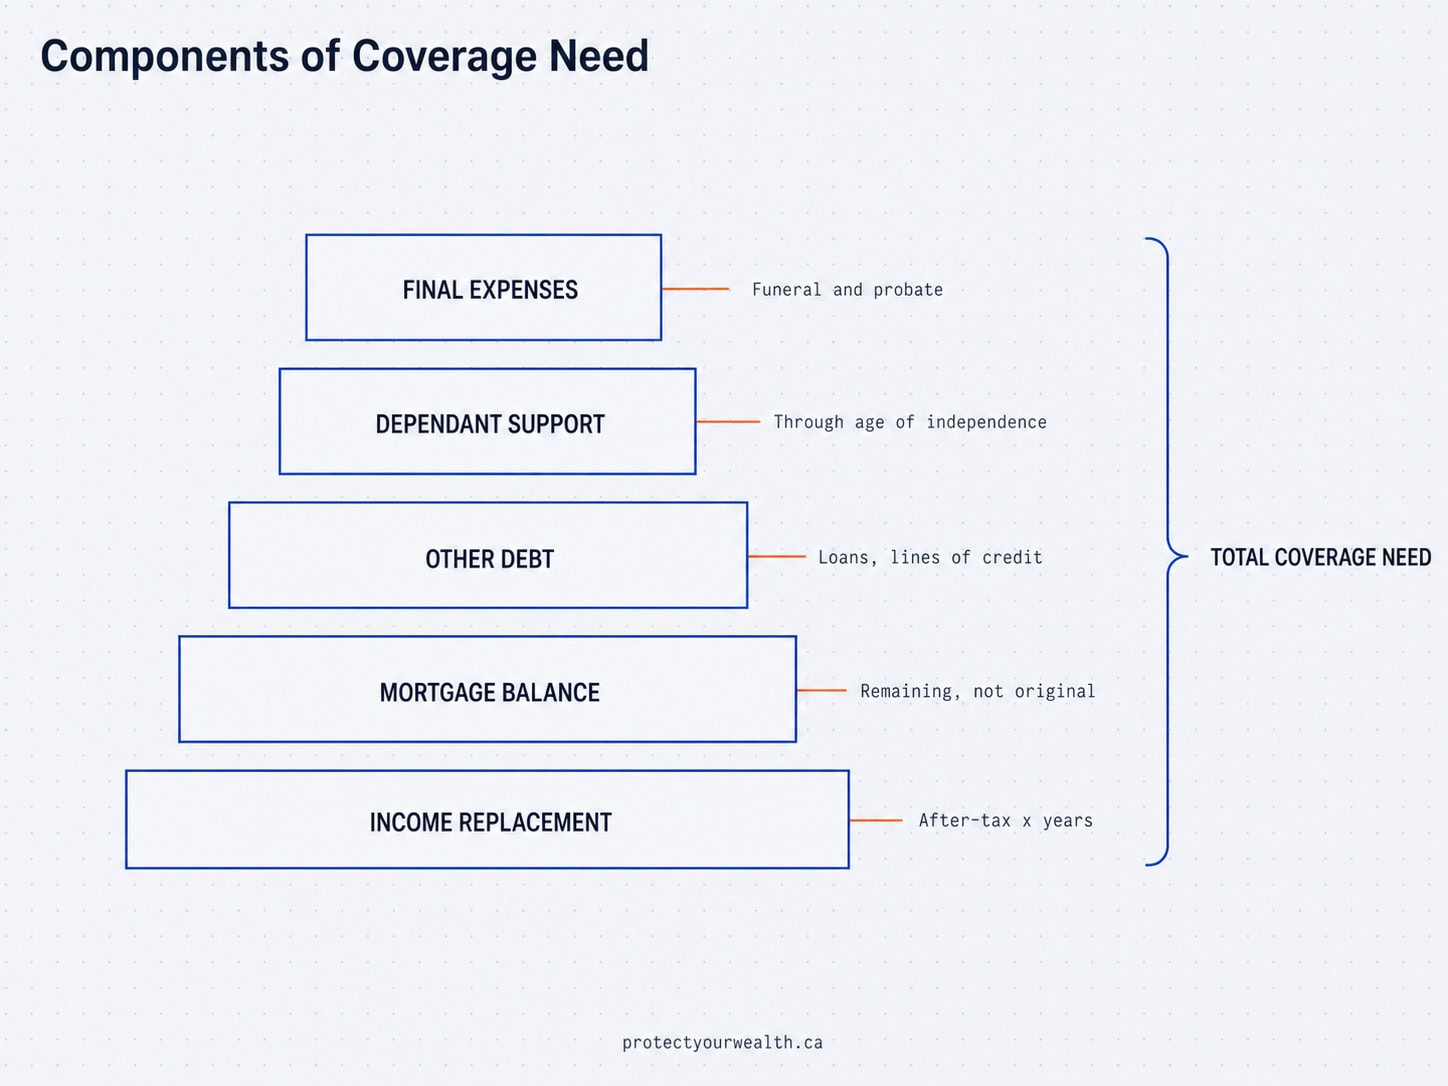
The way I see it, the cleaner approach is to work backwards from after-tax income, then multiply by the number of years you want to replace. The formula I use with clients on the phone is simple: take roughly 60% of gross income to approximate after-tax take-home, multiply by the number of years of replacement (10 years is the floor I start at), and add it to your debt and mortgage coverage. That sum is a practical starting point for your minimum coverage discussion.
The broker formula
(Gross income × 60%) × Years to replace = Income replacement need
Worked example:
$150,000 gross income × 60% = $90,000 after-tax
$90,000 × 10 years = $900,000 income replacement
Add $350,000 mortgage = $1.25M practical starting poing
Why 60%? It’s a fast proxy for after-tax income that lands close to reality across most provinces and most income bands without requiring a tax calculator. For higher earners (top federal bracket plus a high-tax province like Ontario or Quebec), the actual take-home is lower, closer to 50 to 55%. For lower-income earners, take-home runs higher, sometimes 70%. The 60% benchmark is the middle. This is a planning shortcut, not a tax calculation. Higher-income households, incorporated professionals, and families with uneven income sources should verify the after-tax number more precisely.
Why 10 years as the floor? Because that’s the minimum window your family needs to either rebuild earning capacity, finish raising kids, or restructure their living situation. Anything shorter assumes a level of financial flexibility most households don’t have. Many clients land at 15 or 20 years of replacement instead, particularly when kids are young.
Why not 10x gross?
Gross income overstates the actual loss to your household. After-tax math gives you the number that matches your family’s real cost of living.
Why round up to $1M?
Insurance carriers price coverage in tiers. Premiums often drop slightly per thousand at the $1M and $2M thresholds, so rounding up is sometimes cheaper than rounding down.
Why a 10-year minimum?
Most families need at least a decade to absorb the loss of a primary income, restructure expenses, and rebuild stability without depleting savings.
The income replacement number is one piece of the equation. The next sections add mortgage, debt, and dependant coverage. Together they give you the figure the calculator returns. If your number feels off, work backwards through these pieces and the gap is almost always sitting in one of them.
Mortgage and Debt: The First Numbers to Cover
Mortgage and debt coverage is the easiest part of the math, and it’s where I tell clients to start. The mortgage is a wipe-out number. If something happens to you, the goal is for your family to stay in the home without scrambling to refinance or sell. That means coverage should wipe out the remaining balance in full, not the original purchase price.
The debt piece extends beyond the mortgage. Lines of credit, car loans, personal loans, and any co-signed debt all need to be wiped out so the burden doesn’t fall on a surviving spouse or guarantor.
What to include in the wipe-out total
01
Mortgage
Remaining balance, not the original purchase price. Pull this from your latest statement.
02
HELOC and lines of credit
Current outstanding balance. Available credit doesn’t matter, only what’s drawn.
03
Car and personal loans
Sum of all current balances. Do not include leases that end at the vehicle return.
04
Co-signed obligations
Student loans co-signed by a parent or partner, business loans personally guaranteed, or any debt where someone else is on the hook.
05
Final expense buffer
Funeral, burial or cremation, legal fees, and probate costs. Typical range in Canada is $15,000 to $25,000.
One question I get a lot: should I buy mortgage insurance from the bank instead of life insurance to cover the mortgage? Short answer is no. Bank-sold mortgage insurance pays the lender, not your family, and the coverage decreases as you pay down the balance even though the premium stays the same. A term life policy gives the death benefit to your family, lets them decide whether to pay off the mortgage or invest the proceeds, and keeps the same face amount throughout the term. Same protection, more flexibility, and often less expensive depending on age, health, and coverage amount. For a deeper comparison, see our mortgage insurance versus life insurance breakdown.
Once you’ve added up the wipe-out number, layer it on top of your income replacement figure from the previous section. That sum becomes a practical starting point for discussing coverage needs.
Children and Dependants: Long-Term Support Math
Children change the math more than any other variable. Once you have a dependant, your coverage need stretches for as long as that dependant is financially reliant on you. For most families that runs from birth to somewhere between age 18 and 25 depending on whether you’re funding post-secondary, supporting through graduate school, or carrying them through a launch period.
The way I see it, the cleanest way to size dependant coverage is to multiply the years of remaining dependence by the annual cost of raising and supporting that child. Statistics Canada estimates the cost of raising a child to age 18 at roughly $13,000 to $15,000 per year for the basics, with a wide range depending on childcare, extracurriculars, and household income. That’s just the day-to-day cost. Post-secondary is layered on top.
Dependant cost layers
Years 0 to 18: Base support
Roughly $13,000 to $15,000 per child per year for housing, food, clothing, and basic activities. Childcare adds $12,000 to $18,000 per year per child in major cities.
Post-secondary: $80K to $120K per child
Tuition, residence, and living costs for a 4-year undergraduate degree at a Canadian university. RESP grants help, but typically cover only a fraction.
Special-needs or disabled dependants
Long-term care, ongoing medical costs, and lifetime support requirements that may extend well beyond age 25.
Stay-at-home parent replacement
If a non-earning spouse passes, the surviving spouse pays for childcare, household support, and meal prep. Easily $30,000 to $50,000 per year per child in additional costs.
Two situations push this number higher than the average family expects. The first is multiple young children, where the cost compounds and the timeline stretches further (a 4-year-old still has 14 years of base support, two of those if they go to university). The second is a special-needs dependant, where lifetime support flips the calculation. In those cases coverage decisions usually intersect with estate planning and tools like a Henson trust. For a deeper look at coverage decisions for parents in this position, see our guide on life insurance for parents of disabled children.
Single parents land in a slightly different category. With no second earner backing them up, the income replacement piece needs to stretch further. The way I see it, single parents should size coverage at roughly 1.5 to 2 times the typical family figure to account for full responsibility through to independence. That’s not a discount conversation, it’s a structural one.
The dependant-specific math layers on top of income replacement and debt coverage. By this point your number is starting to take shape. The next section covers a piece of the math most calculator pages skip entirely.
Life Insurance for Renters and the Self-Employed
Most “how much life insurance” content treats renters as an afterthought, and self-employed Canadians as a footnote. That makes no sense to me. The single most important variable in any coverage recommendation is income replacement, and that doesn’t disappear just because you don’t have a mortgage.
If you’re not here, your income disappears with you. The question is what your beneficiaries lose, not whether you happen to own real estate. A renter with a partner and two kids has the same income replacement need as a homeowner with the same family situation. The mortgage is one line item among many. It’s not the line item that defines whether you need coverage in the first place.
What renters should still cover
Income replacement
Same math as homeowners. After-tax income times years of replacement. The biggest piece of any coverage recommendation.
Co-signed and personal debt
Student loans co-signed by a parent, lines of credit, car loans, and personal loans don’t disappear. Whoever co-signed is on the hook.
Final expenses and estate costs
Funeral costs, legal fees, probate, and any tax owing on registered assets at death. Renters face the same end-of-life costs as homeowners.
Dependant support
If you have kids, a partner who shares expenses, or aging parents you support, the cost of replacing your contribution doesn’t change based on whether you own or rent.
The product mix for renters is generally the same as for homeowners. Term life insurance is the most common recommendation because it’s affordable, the term length matches your highest-obligation years, and it covers the income replacement piece cleanly. Simplified-issue or no-medical products come into play if there’s a health issue making fully underwritten coverage difficult, but that’s a routing decision, not a renter-specific decision. For a closer look at no-medical options, see our no-medical insurance quotes guide.
Self-Employed Canadians: A Different Risk Profile
Self-employed earners face a structural gap most employees don’t think about. There’s no group long-term disability plan from work. There’s no employer life insurance topping up your personal coverage. If you’re a contractor, consultant, or business owner running your own income, the safety net is whatever you’ve built yourself.
This shows up in the calculator at the top of the page. The disability estimate for an employed (T4) Canadian assumes roughly 66.67% of income is covered by a group plan. For a self-employed earner, the calculator runs at 80% because there’s typically no group coverage to offset against. The number is higher because the gap is bigger.
For self-employed Canadians, the planning conversation usually covers three products:
Term life for income replacement and dependant support. Personal disability insurance to replace income if you’re unable to work. Critical illness coverage as a tax-free lump sum on diagnosis of a covered condition. We’ll cover the disability and critical illness pieces in Section 11.
The way I see it, renters and self-employed earners often need more individual coverage than their salaried, mortgage-holding counterparts, not less. The absence of a mortgage doesn’t reduce the income replacement need. The absence of group benefits widens the disability gap. Both groups should be running the calculator, not skipping it.
Life Stage Coverage: How Much at 30, 40, 50, and 65
This is where the calculator output meets reality. Two clients with the same income, same debts, and same dependants can end up with very different coverage recommendations because of one variable the math can’t see: what stage of life they’re in. The right amount of coverage at 32 looks nothing like the right amount at 62, even when the calculator returns a similar number.
The way I see it, the conversation isn’t only about how much coverage. It’s about how long. Term length matters as much as face amount, and the routing changes meaningfully across life stages. Here’s how the conversation typically goes at each stage in my practice.
New mortgage, young family forming
Most clients in this stage are buying a first home, often with a partner, and either planning kids or just had one. The conversation centers on covering the mortgage plus enough income replacement to carry a young family for at least 10 to 15 years. Coverage amounts typically land between $750,000 and $1.5M.
Typical routing: 20-year term is the most popular, sometimes 25-year if kids are young. Tier A fully underwritten carriers (Manulife, Sun Life, Canada Life, Empire, RBC, BMO) compete aggressively at this stage because applicants are healthy and rates are at their lowest. No carrier is dominant; it’s a price and underwriting fit conversation.
Peak obligations, peak earning years
Highest coverage need across any life stage. Mortgage is still substantial, kids are dependent, and income is climbing. Coverage typically falls between $1M and $2M. The income replacement piece runs at least 10 years, often 15 or 20 if kids are young.
Typical routing: 20-year term is most common. Layered term coverage (a 30-year base plus a 20-year layer that drops off when the mortgage is paid down) starts to make sense here for clients who want decreasing protection without overpaying for the long tail.
Mortgage near payoff, savings significant
Term insurance is still popular at this stage, but the term length shortens. Most clients are looking at 10 or 15 years to bridge to retirement. Coverage amounts come down because mortgage balances are smaller and savings have grown. Income replacement matters less because retirement is closer and the dependant runway is shorter.
Typical routing: 10 to 15-year term remains the most cost-effective. This is also the stage where conversations about permanent coverage start, especially for estate planning, registered asset tax at death, and final expense funding.
Estate planning and final expense focus
Coverage at this stage is usually permanent and for life. Amounts of $25,000 to $100,000 are popular for final expense and estate cleanup. Some clients still have a mortgage balance they want covered, in which case 10 to 15-year terms come back into the picture for that piece.
Typical routing: Simplified-issue products from Canada Protection Plan and Assumption Life are commonly used at this stage. Underwriting is faster, the application is health-question only (no medical exam), and the products are designed for the 60+ market. Tier A fully underwritten products remain available for healthy applicants, and the right path depends on your health profile and the carrier’s underwriting appetite.
Where the Calculator Gets Ignored Most
The biggest mismatch between calculator output and what people actually buy shows up at the youngest end of the life-stage spectrum. Someone at 28 doesn’t always understand how valuable their income replacement is, or what the impact of them not being there would be over a much longer period of time. A 28-year-old has 35 to 40 years of earning ahead of them. A 58-year-old has 5 to 10. The calculator captures that math correctly. Younger clients tend to dismiss the result because the number feels enormous compared to their current lifestyle.
The way I push back on that conversation is simple: the cost of locking in coverage at 28 is dramatically lower than at 38. Premiums climb every year, and the longer you wait, the more expensive the same coverage gets. If your earning years are still ahead of you, the calculator is showing you what that earning capacity is actually worth. Buy what you can afford now, lock in the rate, and revisit if the situation changes.
For clients in their late 30s and 40s, the mismatch usually goes the other direction. People buy too little because they fixate on the mortgage and forget the income replacement piece. The calculator returns $1.5M and they buy $500K because $500K is what would pay off the house. The mortgage is one line item, not the whole answer.
A note on layered term coverage: Some clients want their coverage to decrease over time to match falling obligations. Instead of buying one large 30-year term, you can layer policies (e.g., a 30-year base plus a 20-year rider plus a 10-year rider) so total coverage steps down as kids grow up, mortgage is paid, and savings accumulate. The premium drops at each layer’s expiry. This is a real practice, not theory. It’s most useful for clients carrying high coverage in their late 30s and 40s who want the protection now but don’t want to overpay for the long tail.
If your number from the calculator falls outside the typical range for your life stage, the gap is usually in one of two places: how long you actually need coverage, or whether you’ve accounted for income replacement properly. The next sections walk through where existing assets and benefits fit (or don’t) and how to spot the signs that your current coverage is too low.
Why RRSPs and Group Benefits Don’t Fully Offset Coverage Need
One of the most common mistakes I see is treating retirement savings and group life coverage as a one-for-one offset against your insurance need. The math feels right at first. You have $400,000 in your RRSP and $250,000 in group life through work, so surely your family is covered for $650,000, right? Not really. Both numbers shrink in ways most people don’t realize until it’s too late.
Group benefits are the easier of the two to misread. Most employer life insurance policies cover one to two times your annual salary. That’s helpful, but it’s a fraction of the income replacement piece your family actually needs. The bigger issue is portability. Group coverage typically ends when your employment does, and there’s a narrow conversion window (often 31 to 60 days) to switch to individual coverage without medical underwriting. Miss the window or skip the conversion and you’re starting from zero, often at a stage in life when underwriting has gotten harder.
RRSPs, RRIFs, LIRAs, LIFs, and pension commuted values are the bigger trap. They feel like assets your family inherits. They’re not. They’re tax-deferred income that becomes fully taxable in your final year unless they roll to a qualifying beneficiary. The way I see it, this is the single most under-discussed estate planning issue in Canadian financial planning, and it’s where the calculator below earns its keep.
The 50% problem with non-spouse beneficiaries
If your registered accounts pass to anyone other than a spouse or financially dependent child with a disability, the full balance is added to your final-year income. For most retirees, that pushes the inclusion into the top marginal bracket, which means roughly 45% to 54% may be payable in tax depending on your province, income, deductions, and beneficiary structure. A $600,000 RRSP can shrink to $300,000 net by the time it lands in your kids’ hands.
Run your own numbers in the calculator below. It estimates the tax owing on RRSPs, RRIFs, LIRAs, LIFs, and pension commuted values at death across all 13 provinces and territories, and shows you how the result changes if you switch the beneficiary designation. Spouse rollover defers the tax. Adult kids, siblings, friends, or your estate trigger the full deemed income.
Registered Assets at Death Calculator
See how much of your RRSPs, RRIFs, LIRAs, LIFs, and pension will be lost to income tax at death, and how permanent life insurance can cover the bill so your family receives the full value.
Using Tax Year 2026 Information
Tax data last verified April 2026. Sources: CRA T4127 Payroll Deductions Formulas, KPMG Personal Tax Tables (Jan 2026), TaxTips.ca, provincial budget documents.
Enter current values. If you have multiple accounts of the same type, enter the combined total. Leave blank any that do not apply.
Only if you have a defined benefit pension and would take a lump-sum commuted value at death rather than rolling to spouse.
Calculator assumes the full registered balance is deemed income in the year of death.
Includes CPP, OAS, pension income, and any employment or investment income earned in the year of death before the deemed disposition. Leave at $0 if the client is fully retired with no other taxable income.
This is the single biggest factor. Flipping this dropdown can shift your family from near-zero tax to maximum tax.
If you ran the calculator and the loss-to-tax number came in higher than you expected, you’re in the situation most people don’t realize they’re in. Withdrawing your RRSP early is rarely the answer because it triggers tax during your retirement years and erodes the savings. One common planning solution is permanent life insurance sized to cover the eventual tax bill, so the registered accounts pass through to your beneficiaries closer to fully intact.
This is one of the legitimate use cases for permanent coverage that doesn’t get discussed enough. Term insurance covers your peak-obligation years. Permanent insurance covers the tax bill on registered assets at death. They solve different problems and they’re not interchangeable.
Coming back to the original question: how much do RRSPs and group benefits actually offset your life insurance need? The honest answer is “less than you think.” Group coverage offsets a thin slice of income replacement during employment. Registered savings offset only if they roll to a spouse, and even then the tax problem reappears on the second death. The right approach is to size your insurance need first, then layer in offsets carefully, not to assume your family is covered just because the dollar totals look big on paper.
8 Signs Your Coverage May Be Too Low
If you already have life insurance, the question shifts from “do I need any?” to “do I have enough?” Most underinsurance happens quietly. You bought a policy at one stage of life, your situation changed, and the coverage didn’t keep pace. Here are the eight signs I look for in a policy review.
1
You’re relying only on group coverage from work
Most employer policies cover one to two times salary, end when employment ends, and have a tight conversion window. Group coverage is a starting point, not a destination.
2
You have a stay-at-home spouse and they’re uninsured
A non-earning spouse provides childcare, household management, and meal prep that has real replacement cost. If they’re not covered, the surviving earner faces $30,000 to $50,000 per year in additional costs per child.
3
Your income has gone up significantly since you bought the policy
A policy sized for a $75,000 income doesn’t cover a $150,000 income. The income replacement piece scales linearly with earnings. If you’re earning meaningfully more, your coverage gap has widened.
4
You bought a new home or took on a larger mortgage
Mortgage debt is the easiest line item to overlook in a coverage review. If your mortgage balance is higher than when you bought the policy, the wipe-out portion of your coverage is short.
5
You had a child after the policy was issued
Each new dependant adds 18 to 25 years of support obligation plus potential post-secondary costs. A pre-kids policy almost never covers a post-kids family.
6
Your term policy is approaching expiry
Renewal premiums on most term policies double or triple. Reviewing two to three years before expiry gives you time to shop the market or convert before rates jump. Wait until renewal arrives and the cost spike is the only thing on the table.
7
You haven’t reviewed your coverage in five or more years
Even with a stable income, inflation alone erodes coverage. A $500,000 policy from 10 years ago has roughly the buying power of $400,000 today. If nothing else changed, this one alone is reason for a review.
8
You’ve added a major asset or set a legacy goal
A vacation property, a rental unit, or an explicit goal to leave a defined amount to children or charity all expand your coverage need beyond the primary mortgage and income replacement math.
If three or more of these signs apply to you, your current coverage is almost certainly out of date. The fix isn’t always a new policy. Sometimes it’s a top-up rider, a layered policy alongside what you have, or a conversion of an existing term policy. The way I see it, the goal of a coverage review is to surface the gap first, then figure out the cleanest way to close it.
When a Higher Amount Is Justified
The standard income-replacement-plus-debt math works for most households. There are three situations where the calculator output is the floor, not the ceiling, and the right coverage amount climbs meaningfully higher: business owners, incorporated professionals taking salary plus dividends, and two-earner households where one income carries the bulk of the load.
Business Owners and Incorporated Professionals
If you own a business or run an incorporated practice, your coverage need extends beyond personal income replacement. Three layers usually need to be funded separately. Personal coverage replaces your income to the household. Key person coverage protects the business itself if you’re the operator who drives revenue. Buy-sell coverage funds the orderly transfer of ownership to surviving partners or family members under a shareholder agreement.
The buy-sell piece in particular is often missed entirely. If you and a business partner own the company 50-50 and you pass away, your spouse inherits your 50% stake unless there’s a funded buy-sell agreement in place. Most surviving partners can’t write a personal cheque large enough to buy out the family. Life insurance owned on each partner, with the company or the surviving partner as beneficiary, funds that transaction cleanly.
A note on corporate-owned vs personally-owned coverage:
For business owners, there’s a separate planning question of whether the policy should be owned personally or through the corporation. Each ownership structure has tax implications around deductibility, the capital dividend account, and how proceeds flow to beneficiaries. This is a tax and accounting conversation, not a calculator output. Most clients I work with bring their accountant into this discussion before a policy is structured.
Salary Plus Dividend Compensation
If you’re an incorporated professional drawing a mix of salary (T4) and dividends from your corporation, your insurance situation gets more nuanced than a straight T4 employee. Two issues come up regularly. The first is income replacement math: dividends don’t carry the same after-tax math as salary because they’re taxed at different effective rates depending on whether they’re eligible or non-eligible. The calculator at the top handles this, but the coverage need usually lands higher than a salary-only income would suggest.
The second issue is disability insurance underwriting. Most disability carriers insure based on T4 income, not dividend income, because dividends aren’t tied to active work. If you’re drawing $60,000 salary and $90,000 in dividends, the disability coverage you can qualify for is sized to the $60,000 figure. Increasing your salary portion can meaningfully widen the disability coverage available, but it also increases your CPP and personal tax. There’s a trade-off that’s worth running with your accountant.
Two-Earner Households With Asymmetric Income
The standard assumption in most calculators is that two earners contribute roughly equally to household needs. In practice, the income split is rarely 50-50. When one earner brings in 70 to 80% of household income, the calculator should be run twice and the higher earner should carry a coverage amount that reflects their actual contribution, not the average.
The way I see it, the most common mistake here is the lower-earning spouse buying coverage equal to or higher than the primary earner because “we should be covered the same.” Coverage should be sized to financial impact. If one earner makes $200,000 and the other makes $60,000, the $200K earner needs roughly three times the income replacement piece, even though both spouses have the same dependants and the same mortgage. Equal coverage is rarely the right answer.
If any of these three situations apply to you, the calculator output is a starting point. The actual conversation usually expands from there to include the layered planning these situations require. The next section covers the two products that round out the protection picture beyond life insurance itself.
Disability and Critical Illness: The Other Two Legs
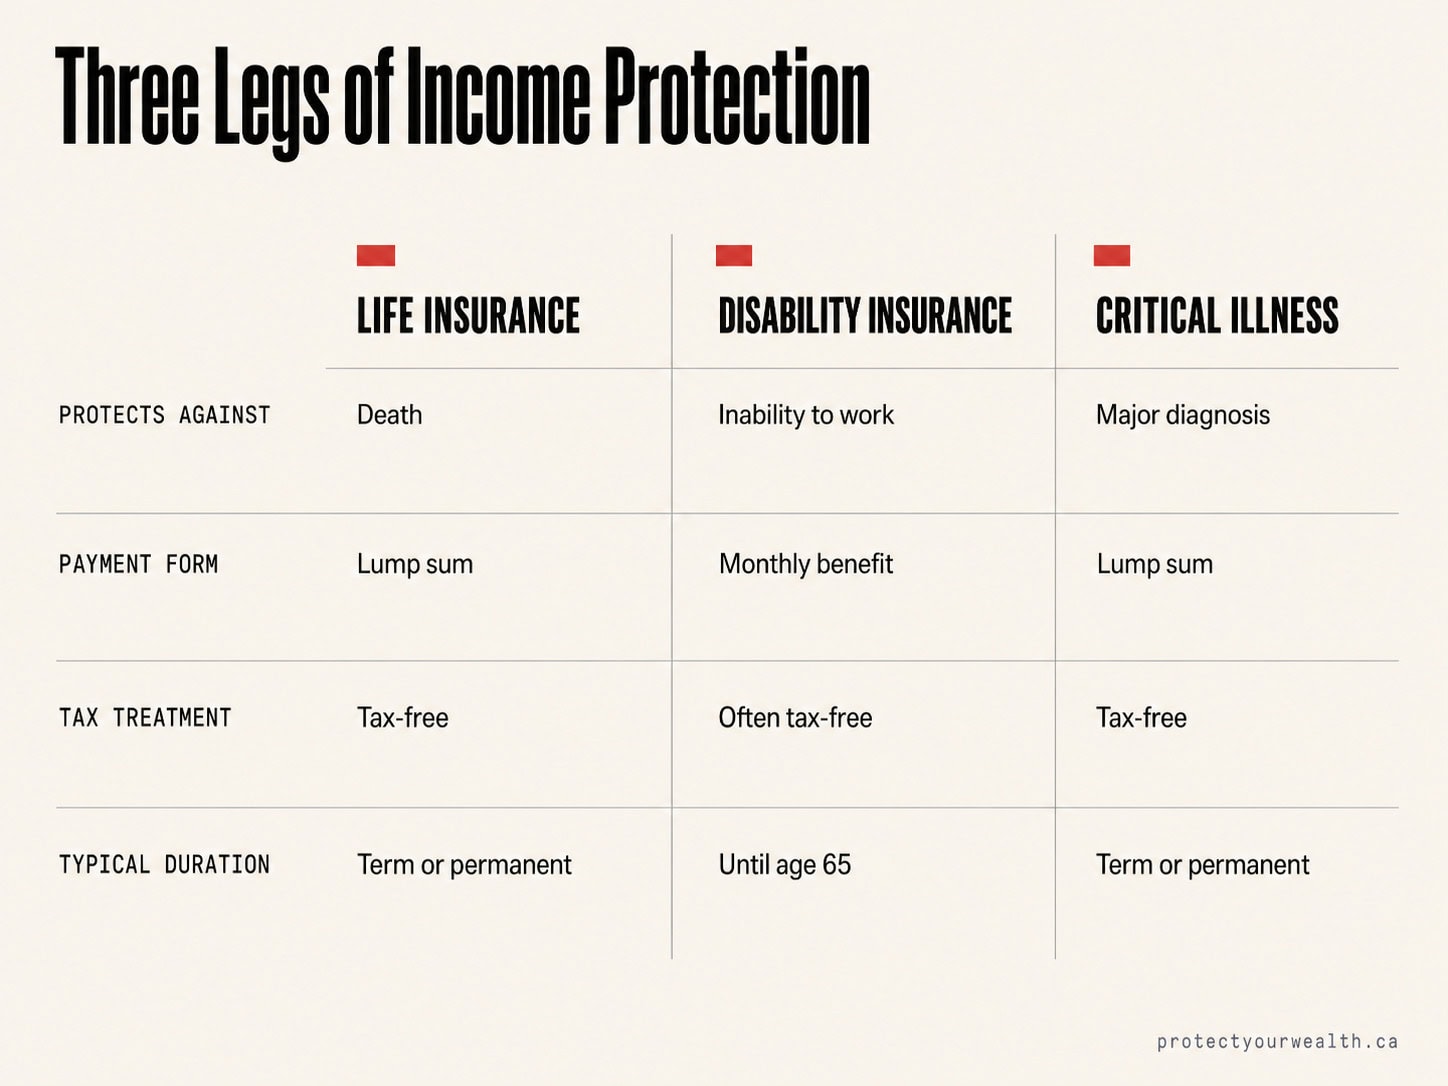
Life insurance covers what happens if you die. Disability insurance covers what happens if you can’t work. Critical illness insurance covers what happens if you survive a serious diagnosis. The way I see it, these three products together form the foundation of personal income protection. Most Canadians focus on the first one and skip the other two, which is exactly backwards from a probability standpoint. For many working-age Canadians, the risk of a disability or serious illness can be just as important to plan for as premature death.
The calculator at the top of this page returns estimates for both products alongside the life insurance figure. Those numbers are starting points, not the full picture, but they’re enough to flag whether you have meaningful gaps.
Disability Insurance
Replaces income if you can’t work
Tax-free monthly benefit. Roughly 60 to 67% of pre-disability income for T4 employees, up to 80% for self-employed earners. Coverage typically continues to age 65. Group plans cover a slice, rarely the full need.
Critical Illness Insurance
Tax-free lump sum on diagnosis
One-time payout, usually 1 to 2 times annual net income. Covers cancer, heart attack, stroke, plus 22 to 25 other defined conditions depending on carrier. Use it for any purpose: medical costs, lost income, mortgage relief, or treatment options.
One thread that connects back to Section 8: permanent life insurance is sometimes positioned alongside disability and critical illness as a fourth piece, specifically when the goal is to cover the eventual tax bill on registered assets at death. Term insurance handles peak-obligation years. Disability and critical illness handle living-event risk. Permanent insurance handles end-of-life tax and estate liquidity. They solve different problems and they often coexist in the same plan. For more on where permanent fits, see our breakdown of whole life insurance benefits.
If your calculator output flagged disability or critical illness gaps, those are worth a separate conversation. The right structure varies by occupation, income type (T4 vs dividend), and existing group coverage. Sizing both products well usually requires running the application through a broker who can compare across carriers.
Frequently Asked Questions
Common questions that come up when sizing life insurance coverage in Canada.
01
How much life insurance do I actually need in Canada?
Most working-age Canadians with a mortgage and dependants land between $750,000 and $2 million in coverage. The right number depends on your after-tax income, the years of replacement you want to fund, your debts and mortgage balance, your number of dependants, and any existing coverage already in place. The calculator at the top of this page returns three figures sized to three different planning horizons. Use the Family figure as a starting point if you have dependent children.
02
Is the 10x your income rule still valid?
It’s a starting heuristic, not a sizing method. Ten times gross income usually overstates the need because it doesn’t account for the after-tax loss your family actually experiences. The cleaner approach is to take roughly 60% of gross income to approximate after-tax take-home, multiply by the number of years you want to replace, and add your debts and mortgage. That sum is your minimum recommended coverage.
03
What if I already have group life insurance through work?
Most employer policies cover one to two times annual salary, end when employment ends, and have a tight conversion window of 31 to 60 days. Group coverage offsets a slice of your need, not the full amount. Most clients in their 30s and 40s with dependants find their group coverage covers between 10% and 25% of what’s actually needed once mortgage, debt, and full income replacement are layered in. Treat group life as a baseline, not a destination.
04
Why don’t RRSPs and RRIFs count toward my insurance offset?
Registered retirement assets (RRSPs, RRIFs, LIRAs, LIFs, and pension commuted values) are tax-deferred income, not assets your family inherits cleanly. Unless they roll to a spouse, common-law partner, or financially dependent child with a disability, the full balance becomes taxable in your final year. For most retirees, that pushes the inclusion into the top marginal bracket, where roughly 45% to 54% may be payable in tax depending on province, income, deductions, and beneficiary structure. They’re an asset, but not a death-benefit offset. The registered assets calculator in Section 8 estimates the actual tax owing in your situation.
05
Do renters need life insurance?
Yes, if anyone depends on your income or shares debt with you. Mortgages are one obligation among many, but they’re not what defines whether you need coverage. Income replacement is the bigger driver, and that doesn’t change based on whether you own or rent. A renter with a partner and dependants has nearly the same coverage need as a homeowner with the same family situation, minus only the mortgage line item.
06
How does coverage change for self-employed Canadians?
Self-employed earners typically need more individual coverage, not less. There’s no group long-term disability plan, no employer life insurance topping up personal coverage, and the safety net is whatever’s been built personally. The calculator runs disability estimates at 80% replacement for self-employed earners (compared to 67% for T4 employees) because the gap left by the absence of group coverage is wider. The product mix usually includes term life, personal disability insurance, and critical illness coverage as a complete picture.
07
When should I review my existing coverage?
At least every five years, and immediately after any major life change: a new mortgage, a new child, a significant income increase, a marriage or divorce, a business start or sale, or the addition of a major asset. Term policies should be reviewed at least two to three years before expiry to give you time to convert or shop the market before renewal premiums spike. Section 9 walks through the full list of signs your current coverage may be too low.
08
Is term insurance always cheaper than permanent insurance?
For the same face amount over a defined term, term is generally much less expensive than permanent. But the products solve different problems. Term covers a window: typically 10, 15, 20, or 30 years matched to your highest-obligation years. Permanent insurance covers your full life and is usually purchased to fund a specific lifelong need, like the eventual tax bill on registered assets at death, or a defined estate transfer to children or charity. The right answer is rarely either-or. Many clients carry both: a larger term policy during peak earning years plus a smaller permanent policy for end-of-life needs.
09
Can the calculator on this page replace working with a broker?
No. The calculator gives you a defensible starting point and three different planning horizons to consider. What it can’t do is route your application across carriers, factor in your underwriting profile, structure ownership for incorporated professionals, or handle the layered conversations that come up when life insurance intersects with disability, critical illness, estate planning, or shareholder agreements. Use the calculator to size the conversation, then run the application through a licensed broker who can compare across carriers.
Next step
Find the right coverage for your situation
If you’re still asking “how much life insurance do I need in Canada,” the cleanest next step is a 15-minute conversation. We’ll review your number from the calculator, walk through your debts, dependants, and existing coverage, and route you to the carrier most likely to give you the best rate based on your underwriting profile. No pressure, no upsell, no obligation.
Where we operate
Based in Hamilton, Ontario, we help Canadians with life insurance and segregated fund solutions across Ontario, British Columbia, Alberta, Manitoba, Saskatchewan, Nova Scotia, and New Brunswick. We work with clients in every major market including Edmonton, Guelph, Mississauga, and Kelowna.